Wednesday, February 8, 2023

How do you use Fibonacci retracement to enter a trade?


Fibonacci retracement is a technical analysis tool that uses horizontal lines to indicate areas of support or resistance at the key Fibonacci levels before the price continues to move in the original direction. To use Fibonacci retracement in trading:


Identify the high and low points in the price trend you want to analyze.

1.     Divide the vertical distance between the high and low points by the key Fibonacci ratios of 23.6%, 38.2%, 50%, 61.8% and 100%.

2.     Plot the horizontal lines at the levels derived from step 2, starting from the low point to the high point.

3.     Observe where the price action approaches or reaches one of the levels, as this can be an indication of support or resistance.

4.     Consider entering or exiting a trade based on the price action near the key levels and other technical or fundamental analysis.

Remember that Fibonacci retracements are just one of many tools used in technical analysis and should not be relied upon solely for making trading decisions.

The "best" settings for Fibonacci retracement in daily trading can vary based on individual trader preferences and the specific market being traded. However, the commonly used levels are the 23.6%, 38.2%, 50%, 61.8%, and 100% retracements. These levels are derived from the key Fibonacci ratios and are believed to indicate potential areas of support and resistance in the market.

It's important to keep in mind that Fibonacci retracements should not be used in isolation, but rather in conjunction with other technical and fundamental analysis to make informed trading decisions. Additionally, it's crucial to understand that no single tool or indicator can guarantee success in the markets, and that traders should always be prepared for the possibility of losses.


Tuesday, February 7, 2023

What is bullish trend


A bullish trend is a trend in which the price of an asset, such as a stock or a currency, is expected to rise. This trend is characterized by a series of higher highs and higher lows, and is often associated with increased buying pressure and optimistic market sentiment.

Bullish trends can be identified through technical analysis techniques, such as trendline analysis, moving averages, and chart patterns. However, it'simportant to remember that no trend is guaranteed to continue and that there can be sudden reversals in market conditions.

Investors and traders who are bullish on a particular asset may look to buy it in the expectation of price appreciation, or to sell short-term options such as call options. However, it's important to consider risk management techniques, such as stop-loss orders, to minimize potential losses.

It's also important to be aware of fundamental factors that can impact the market, such as economic data releases, changes in interest rates, and geopolitical events, as these can have a significant impact on market trends.

In conclusion, a bullish trend can provide potential opportunities for investors and traders to benefit from rising prices, but it's important to approach it with caution and to have a well-rounded investment strategy that takes into account both technical and fundamental analysis. Regular portfolio review, risk management techniques, and staying informed on market conditions can help minimize the risks associated with bullish trends and maximize the potential for returns.

Top Technical Analysis Methods Used by Traders


Technical analysis is a method used by traders and investors to analyze financial market data, such as price and volume, to identify trends and make investment decisions. Here are some common technical analysis methods:

1.       TREND ANALYSIS: Identifying the direction and strength of a trend through the use of trendlines and moving averages.

2.       CHART PATTERNS: Recognizing patterns, such as head and shoulders or double tops and bottoms, to forecast potential price movements.

3.       INDICATOR ANALYSIS: Using technical indicators, such as the Moving Average Convergence Divergence (MACD) or the Relative Strength Index (RSI), to analyze market trends and make investment decisions.

4.       VOLUME ANALYSIS: Using volume data to confirm significant price movements and to identify potential reversals.

5.       ELLIOTT WAVE THEORY: Analyzing market price movements based on the principle that financial markets move in predictable patterns, known as Elliott Waves.

6.       FIBONACCI RETRACEMENTS: Using horizontal lines to identify levels of support and resistance based on the Fibonacci sequence.

7.       BOLLINGER BANDS: A volatility indicator that uses standard deviations to create upper and lower bands around a moving average to indicate overbought and oversold conditions.

8.       CANDLESTICK CHARTING: A method of representing price data using candlestick patterns to identify potential buying and selling opportunities.

These methods can provide valuable insights and information, but it is important to remember that technical analysis is just one aspect of a comprehensive investment strategy and should not be relied on solely.

10 Best Price Action Strategy

 10 Price Action Strategy 


1.       SUPPORT AND RESISTANCE LEVELS: Look for key price levels where the price has bounced back in the past and consider entering or exiting trades based on these levels.


2.       CANDLESTICK PATTERNS: Use candlestick chart patterns, such as the hammer or doji, to identify potential turning points in price.


3.       TRENDLINES: Draw trendlines to identify the direction of the trend and use them to make investment decisions.


4.       MOVING AVERAGES: Use moving averages to identify the direction of the trend and to   identify potential areas of support and resistance.


5.       BREAKOUTS: Look for price breakouts from key levels, such as trendlines or moving averages, to indicate a potential change in trend.


6.       PRICE ACTION RETRACEMENTS: Look for retracements within a trend to identify potential areas to enter or exit trades.


7.       VOLUME ANALYSIS: Use volume data to confirm significant price movements and to identify potential reversals.


8.       PRICE ACTION DIVERGENCE: Look for divergences between the price and an indicator, such as the Relative Strength Index (RSI), to identify potential reversals.


9.       PRICE ACTION CONFLUENCE: Look for confluence between different price action signals, such as trendlines and moving averages, to make more informed investment decisions.


10.   RISK MANAGEMENT: Implement strict risk management strategies, such as stop-loss orders and position sizing, to minimize potential losses and protect your capital.


x

Sunday, February 5, 2023

Most Successful Candlesticks

 Bullish Candlestick 


A Bullish candlestick is a type of candlestick pattern in technical analysis that signals a potential upward price movement. The pattern is formed when the closing price of an asset is higher than its opening price, and is considered an indication of bullish sentiment in the market.


The real body of a bullish candlestick is typically white or green and is longer than the real body of a bearish candlestick. The length of the upper shadow, if present, is also typically short. Bullish candlesticks are often used by traders to identify potential buying opportunities and to confirm an uptrend in the market.

Bearish Candlestick 


A Bearish candlestick is a type of candlestick pattern in technical analysis that signals a potential downward price movement. The pattern is formed when the closing price of an asset is lower than its opening price, and is considered an indication of bearish sentiment in the market. 


The real body of a bearish candlestick is typically black or red and is longer than the real body of a bullish candlestick. The length of the lower shadow, if present, is also typically short. Bearish candlesticks are often used by traders to identify potential selling opportunities and to confirm a downtrend in the market.


Doji candlestick


Doji is a term used in technical analysis to describe a candlestick pattern in stock charting. It signals indecision or a potential reversal in price direction and is formed when the opening and closing prices of an asset are the same or nearly the same. 


The pattern is considered a bullish or bearish reversal depending on preceding price action and future price movements.


 It is used by traders to identify potential buy or sell signals in the market.


Hammer candlestick


A Hammer candlestick is a bullish reversal pattern in technical analysis that is formed when the price of an asset declines significantly, but then rallies to close near its opening price. The pattern is characterized by a long lower shadow, which is at least twice the length of the real body, and a small real body near the upper end of the trading range, with little or no upper shadow. 


The long lower shadow indicates that the bears pushed the price down, but the bulls took control and pushed the price back up, closing near the opening price. Traders interpret this pattern as a potential buy signal, indicating that the trend is likely to reverse and the price is likely to rise.


Inverted Hammer Candlestick 


The Inverted Hammer candlestick is a bullish reversal pattern in technical analysis that is formed at the end of a downtrend. It is characterized by a small real body near the lower end of the trading range, with a long upper shadow that is at least twice the length of the real body, and little or no lower shadow. 


The long upper shadow indicates that the bears pushed the price down, but the bulls took control and pushed the price back up, close to the opening price. Traders interpret this pattern as a potential buy signal, indicating that the trend may be about to reverse and the price is likely to rise. However, the reliability of the Inverted Hammer signal is increased when it is confirmed by a subsequent price increase.


Shooting star candlestick 


A Shooting Star candlestick is a bearish reversal pattern in technical analysis that is formed at the end of an uptrend. It is characterized by a small real body near the upper end of the trading range, with a long lower shadow that is at least twice the length of the real body, and little or no upper shadow. 


The long lower shadow indicates that the bulls pushed the price up, but the bears took control and pushed the price down, close to the opening price. Traders interpret this pattern as a potential sell signal, indicating that the trend may be about to reverse and the price is likely to fall. However, the reliability of the Shooting Star signal is increased when it is confirmed by a subsequent price decrease.


Difference between Shooting Star and Inverted Hammer 

A shooting star and an inverted hammer are both bearish reversal patterns in technical analysis.

A shooting star occurs after an upward trend and is characterized by a small real body at the lower end of the price range, with a long upper shadow and little or no lower shadow.


An inverted hammer, on the other hand, occurs after a downward trend and is characterized by a small real body at the upper end of the price range, with a long lower shadow and little or no upper shadow.


In summary, the main difference between the two patterns is their formation after an upward or downward trend and the location of the small real body.


Hanging Man candlestick


The Hanging Man candlestick is a bearish reversal pattern in technical analysis that is formed at the end of an uptrend. It is characterized by a small real body near the upper end of the trading range, with a long lower shadow that is at least twice the length of the real body, and little or no upper shadow. 


The long lower shadow indicates that the bulls pushed the price up, but the bears took control and pushed the price down, close to the opening price. Traders interpret this pattern as a potential sell signal, indicating that the trend may be about to reverse and the price is likely to fall. However, the reliability of the Hanging Man signal is increased when it is confirmed by a subsequent price decrease.


.


15 Min master candle Strategy


15 Min  master candle

In this strategy we will search for stocks where 1st 15 min candle holds at next at least 3 candles 15 min inside


https://www.tradingview.com/x/BLrxylaz

Buy rule :- 

mark high and low of master candle when any candle closes above master candle we will buy at closing price

Sell rule :-

 when any candle closes below master candle we will sell at closing price.

Stop Loss : -

 SL will be 0.9 % and min target at least 1:2.

OHL Trading Strategy


OHL Trading

 After the market has opened at 9.15 am, we have to identify the share which is opening at high or opening at low.

1.       If share opens at high then we will look a short entry

2.       If share opens at low then we will look for a buy entry.


Buy rule :

1st candle open = low.

Wait for first candle to complete it should be bullish candle.

Wait for the price o close above high of 1st candle

Entry after the price closes above 1st candle high

Sell rule :-

Exactly opposite to buy

Stop loss : - 

do not take target exit at 3.20 p m stop loss be max 0.9 % of trade price.

Gap trading Strategy

 Gap trading : -

If the market open at price higher than previous day high it is said to be outside gap up open.

If the day’s first candle 9.15 with gap up open price gives closing above high go for buy trade and vice versa for gap down short trading.

1st trade :- 


https://www.tradingview.com/x/xqptByV1

2nd Trde Same Day : -


https://www.tradingview.com/x/nHv7Q9KR

Buy rule: - 

Search for stocks which opens and closes above previous day high. Mark first 5 min opening range. Wait for a candle to close above first five min opening range. When any candle closes above range buy at closing price.

Sell rule: -

 exactly opposite to buy trade


Stop loss do not keep target. Exit 3.20 pm stop loss should be max .9 % of trade price.

Master Candle strategy


Master Candle strategy: -

There are different ways of looking at this trading strategy but in its simplest from a master candle is a candle which contains the highs and lows of at least the next four candles after it.

The formation of a true master candle can see on a chart if the next four candles are consolidation inside of the tall master candle.

The master candle trading strategy is famous for the fact that is provides clear pattern and also helps in the identification of breakout points, making it especially useful for traders in the long run.

It is always useful to follow a certain set of guidelines or rules when using any trading strategy and the same is true for the master candle trading strategy. Following is brief set of rule which should be kept in mind when using the particular trading strategy.


You should not try to trade near a support or resistance SR zone.

1.        There should be no trade against a support /resistance zone that is closer than the master candles height.

2.       Only take a trade when a candle breaks the master candle high or low.

3.       It is recommended to always target the master candle size when exiting the trade.

4.       Place you stop loss order in the opposite direction of the entry at the other end of the master candle. So in a long trade the stop should be at the master candles law while in a short trade the stop should be at the master candles high.

It is strongly recommended to develop your own understanding of the master candle trading strategy and master it with a trial and error approach. Take real life scenarios and make your experiences. Slowly your knowledge and skills will be refined and you will be in a better position to make use of the master candle trading strategy.

Buy rule : -

 we will buy at the high of the master candle 5 ot 10 paisa buffer

Sell rule  :- 

we will sell at the low of the master candle .

Stop loss :-

 SL length of master candle

Price Action Strategy


 Price Action Strategy HH LL:-

Trends are made of a series of highs and lows.

If the high and low series is like higher and higher low then it is considered as uptrend and if series is like lower high and lower low then trend is considered as down trend

 If you use day time frame you will get better result.

Mark fresh high which is marked gets broken we will take buy trade or we will invest in that stock.


https://www.tradingview.com/x/MAGBnlkm

Buy rule:

 mark fresh high and fresh higher low. When fresh high which is marked gets broken we will take buy trade or we will invest in that stock.

Sell rule: 

Mark fresh low and fresh lower high. When fresh low which is marked gets broken we will take sell trade or we will short the stock.


Stop loss: 

Trail SL as showing in image


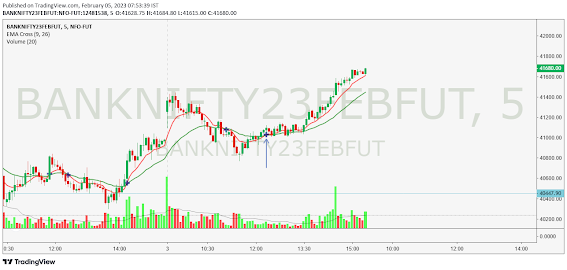
EMA Cross Over Strategy


EMA Cross Over Strategy :

 Most trader assume the trend is your friend and trade with the main trend of the chart. So h ow can we determine the direction of the trend either it is uptrend or downtrend? This strategy helps you to know the exact trend.

This strategy uses two exponential moving averages. (EMAs). First one is shorter period EMA and second one is longer period EMA. You can change the EMA value.

A bullish crossover occurs when the shorter moving average crosses above the longer moving average. This is also known as a golden cross.

A bearish crossover occurs when the shorter moving average cross below the longer moving average. This is known as a dead cross.


Here we are using 9 EMA and 26 EMA.


Buy rule : 

When 9 EMA crossover above 26 EMA we will buy at high of closing candle.


Sell Rule :

When 9 Ema crossover below 26 Ema w will sell at the low of closing candle.


Stop Loss :

Trail Sl according to 26 EMA . Keep SL and target minimum 1:2 .

5 MIN Breakout strategy


5 MIN Breakout strategy


Opening range breakout strategy is one of the best and simple intraday strategy.

The first hour or half an hour of the trading day is the most volatile- this is calling the opening range of the Day.

As bears and bulls fights it to take control for the day, the volatility creates a price-range one can trade from, using it as the basis for decision making.

Here we are using Day’s first 5 min candle as opening range.

https://www.tradingview.com/x/jKasT8JW

Rules:

 Buy rule:

1.       Mark high and low of first min candle which become our opening range.

2.       If any other candle breaks high of the opening range an close above it, then go for long.

      Sell Rule:

1.       Mark high and low of first 5 min candle range which becomes our opening range.

2.       If any other candle breaks low of opening range and closes below it, then go for short.


Stop Loss: Stop loss is 1 % or length of opening range whichever is lower if there is any Doji previously then the low or high of the Doji is SL.

Do not keep target. Trail your SL and enjoy the full ride.