BEARISH CART PATTERNS :: EVERY TRADER SHOULD KNOW
INVERTED CUP WITH HANDLE
Directional Bias: Bearish
Pattern Type: Continuation
Pattern Description: This pattern occurs within the context of a longer downtrend and is characterized by the price forming an inverted u-shaped cup with a short handle on the right. The duration of the cup should last at least 7 weeks if using a daily chart.
Volume Description: Volume will typically follow the opposite of the shape of the cup, with high volume as the left lip forms, falling volume as the rounded top of the cup forms and rising volume toward the right lip and on the breakout.
Breakout Confirmation: A close below the lower trend-line drawn across the handle with above average volume.
Measuring Technique: The price target is obtained by measuring the right lip to the top of the cup and then subtracted from the price level of the right lip.
Statistical Notes: The pattern has a low failure rate but doesn’t move as strongly as other patterns. Patterns with shorter handles perform better than longer handles, and deeper cups with the left lip slightly lower than the right lip perform better.
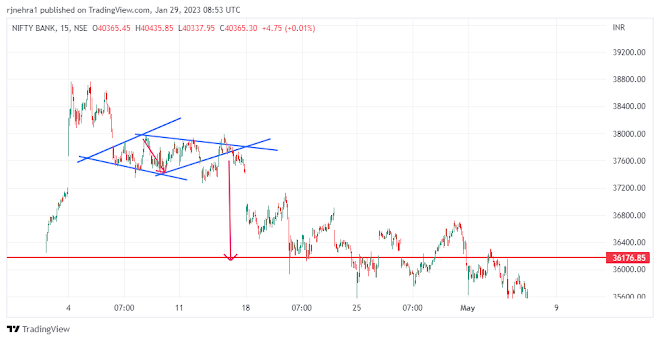
DIAMOND TOP
Directional Bias: Bearish
Pattern Type: Reversal
Pattern Description: This pattern occurs within the context of a longer uptrend. Initially the pattern begins a broadening formation with higher highs and lower lows, but then begins to narrow with lower highs and higher lows.
Volume Description: Volume tends to drift downward during the formation and expand on the breakout.
Breakout Confirmation: A close below the lower trend-line drawn across the upward-sloping highs with above average volume.
Measuring Technique: Measure the widest point of the diamond’s range and subtract it from the breakout level.
Statistical Notes: Breakouts near the 1-year high typically outperform, and pullbacks following the breakout generally hurt performance. The pattern has a low failure rate with decent upside potential but tend to fallback once the target high is reached. Formations with more range between highs and lows perform better than shorter ranges.
DOUBLE TOP
Directional
Bias: Bearish
Pattern Type: Reversal
Pattern Description: This pattern occurs within the context of a longer uptrend. The pattern forms two equal highs with each high forming a v shaped top with a single day’s candle touching the high.
Volume Description: Volume tends to drift downward during the formation and expand on the breakout.
Breakout Confirmation: A close below the lower trend-line drawn horizontally across the intervening low between the highs with above average volume.
Measuring Technique: Measure the distance between the low and the two highs and subtract it from the breakout level.
Statistical Notes: Formations with more range between highs and lows perform better than shorter ranges.
FLAG BEARISH
Directional Bias: Bearish
Pattern Type: Continuation
Pattern Description: This pattern occurs within the context of a longer downtrend and following a steep, quick downward move. Following the move, the pattern then forms a short horizontal or upward sloping channel shaped like a flag. The flag portion of the pattern shouldn’t last more than 3-4 weeks if on a daily chart.
Volume Description: Volume tends to drift downward during the formation and expand on the breakout.
Breakout Confirmation: A close below the lower trend-line drawn across the lows with above average volume.
Measuring Technique: Measure the length of the previous steep move leading into the flag, and then subtract that amount from the breakout level.
Statistical Notes: Formations with more range between highs and lows perform better than shorter ranges. Flag formations that breakout in the direction of the prevailing market trend tend to perform better, and flags without gaps tend to perform better. Bull flags typically perform better than bear flags.


No comments:
Post a Comment